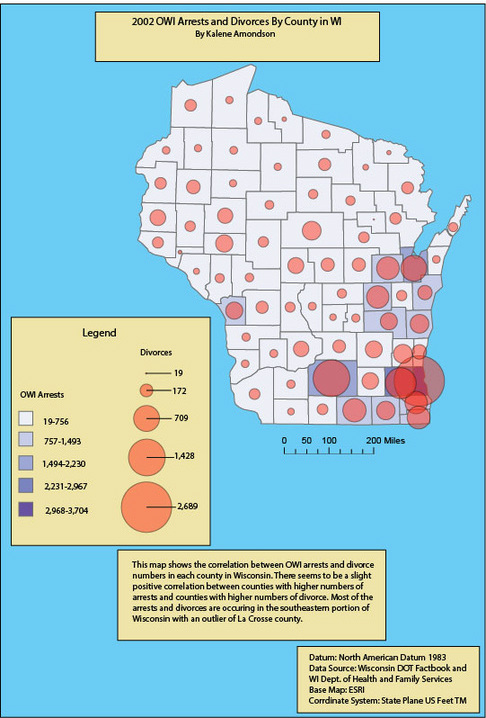
As I was doing my OWI map I realized I wanted to know if there was a correlation between divorce rates by county in WI and the OWI arrests. I found that there was some correlation between the arrests and divorces. I feel that this map does a lot of things neatly all at once. For one, it shows two different sets of data on one map. and it also is easy to read and see patterns. I really liked doing this map because I feel that I can use this technique in my future work. I think that relating two different sets of data on one map and seeing a pattern will be helpful to me as I go into my history career.
 RSS Feed